Create an experiment
Create a W&B Experiment.
2 minute read
Track machine learning experiments with a few lines of code. You can then review the results in an interactive dashboard or export your data to Python for programmatic access using our Public API.
Utilize W&B Integrations if you use popular frameworks such as PyTorch, Keras, or Scikit. See our Integration guides for a for a full list of integrations and information on how to add W&B to your code.
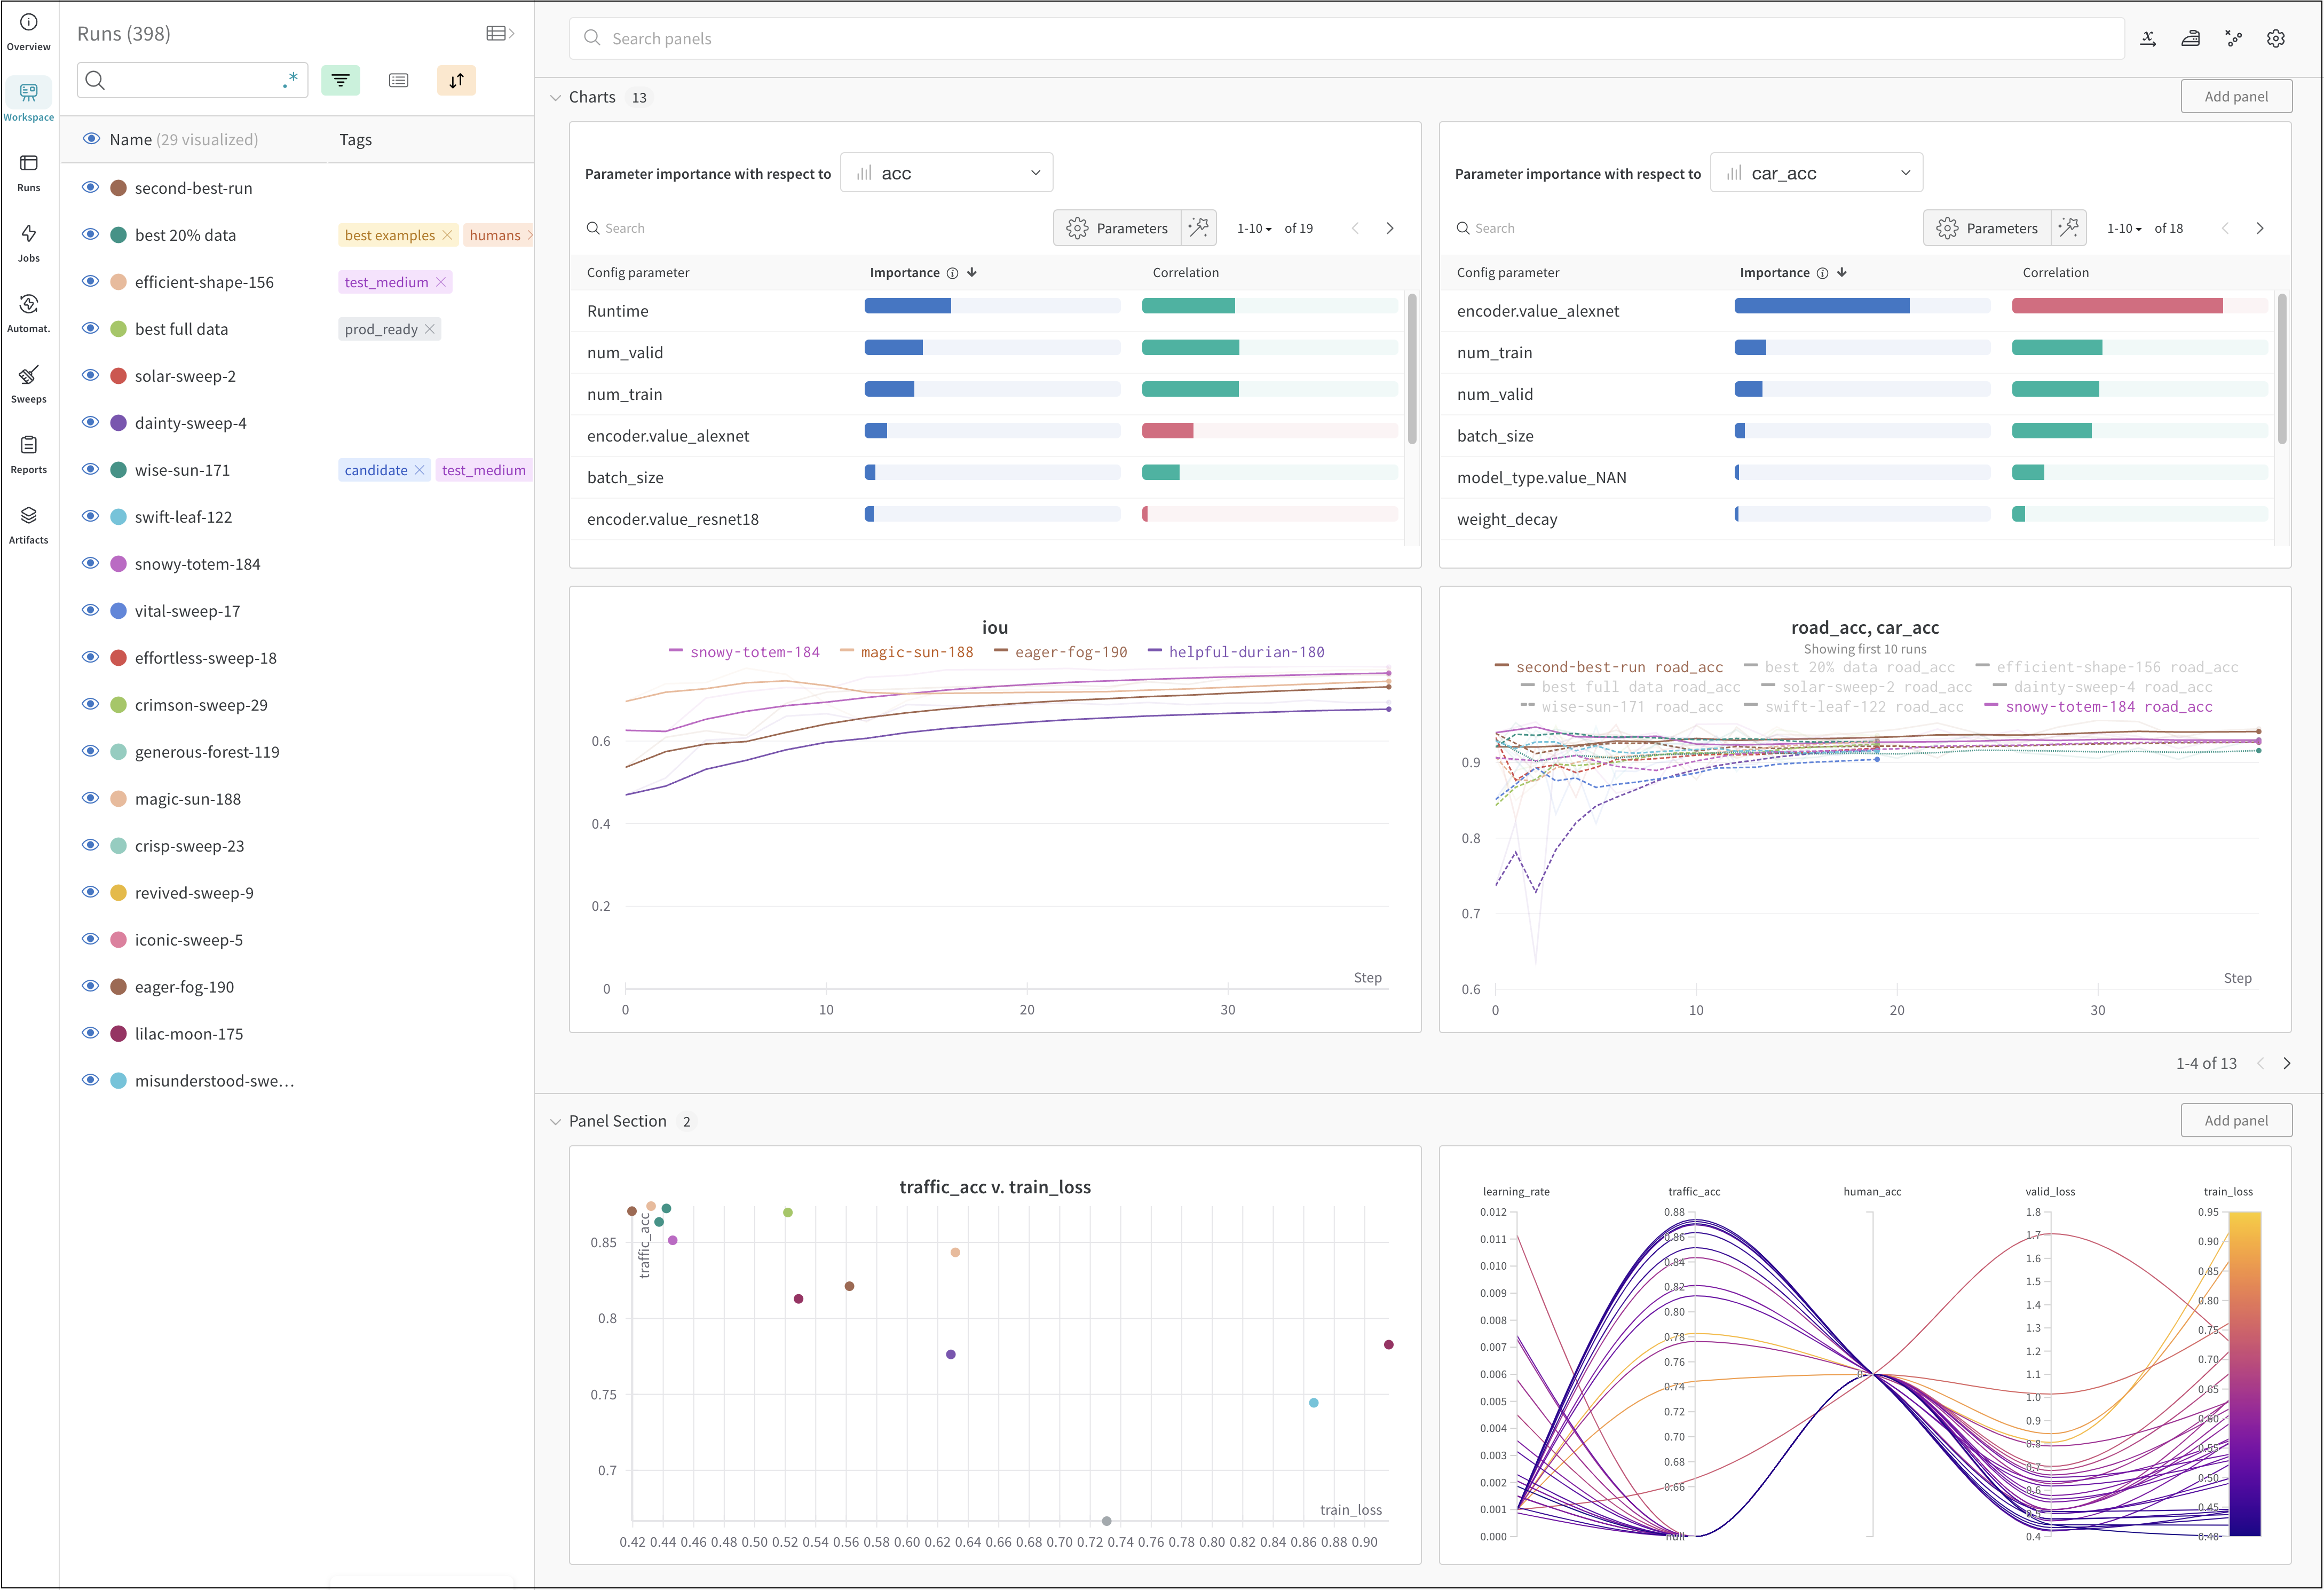
The image above shows an example dashboard where you can view and compare metrics across multiple runs.
Track a machine learning experiment with a few lines of code:
run.config).run.log()) over time in a training loop, such as accuracy and loss.The following code demonstrates a common W&B experiment tracking workflow:
# Start a run.
#
# When this block exits, it waits for logged data to finish uploading.
# If an exception is raised, the run is marked failed.
with wandb.init(entity="", project="my-project-name") as run:
  # Save mode inputs and hyperparameters.
  run.config.learning_rate = 0.01

  # Run your experiment code.
  for epoch in range(num_epochs):
    # Do some training...

    # Log metrics over time to visualize model performance.
    run.log({"loss": loss})

  # Upload model outputs as artifacts.
  run.log_artifact(model)
Depending on your use case, explore the following resources to get started with W&B Experiments:
For best practices and tips for experiments and logging, see Best Practices: Experiments and Logging.
Create a W&B Experiment.
Use a dictionary-like object to save your experiment configuration
Compare versions of your model, explore results in a scratch workspace, and export findings to a report to save notes and visualizations
A playground for exploring run data with interactive visualizations
Learn about the basic building block of W&B, Runs.
Keep track of metrics, videos, custom plots, and more
se W&B with Jupyter to get interactive visualizations without leaving your notebook.
Keep your pages in W&B faster and more responsive by logging within these suggested bounds.
Import data from MLFlow, export or update data that you have saved to W&B
Set W&B environment variables.
Was this page helpful?
Glad to hear it! Please tell us how we can improve.
Sorry to hear that. Please tell us how we can improve.